Plotting
For some Classes, BaderKit provides a basic plotting API. This is also what the GUI is built on. This tutorial introduces the basics of how to use a BaderKit Plotter class. We will use the BadelfPlotter class to plot the electride electron in Ca2N.
Note
We will not show the VASP calculation used in this tutorial. The resources can be downloaded at the bottom of this page or you can follow the VASP portion of this tutorial.
BaderKit
-
First, import the
Badelfclass.from baderkit.elf_analysis import Badelf -
Create a
Badelfinstance from file.badelf = Badelf.from_vasp() -
Create the plotter.
This should open a window similar to the following.plotter = badelf.to_plotter()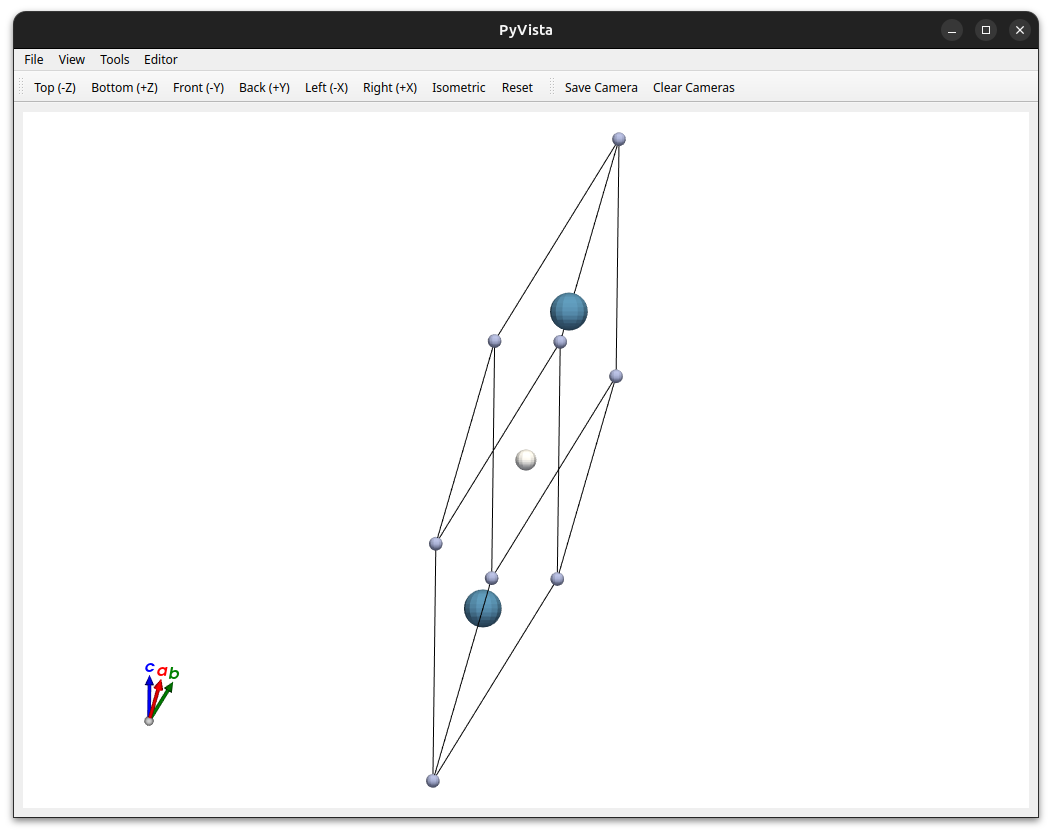
-
Now we want to update the settings so that our plot looks a bit nicer. First, we turn on physically based rendering which improves the visual quality of our atoms at the cost of some graphical resources. We also make the atoms slightly metallic in appearance.
plotter.pbr = True
plotter.atom_metallicness = 0.5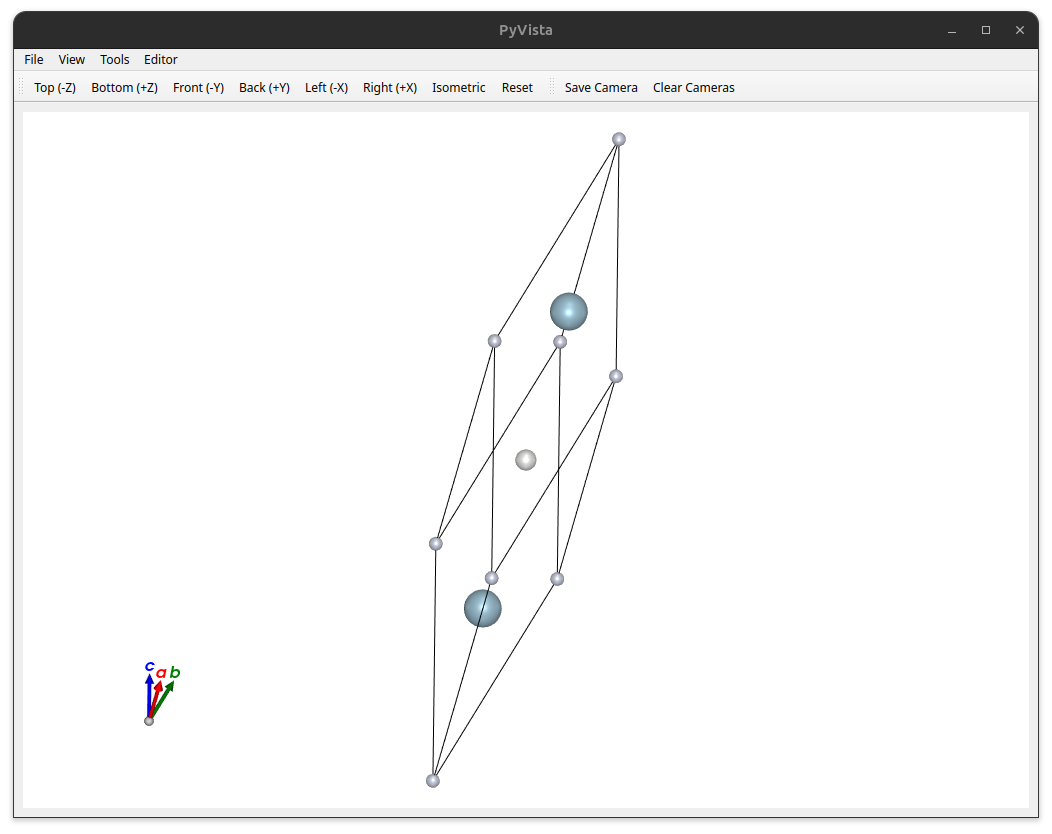
-
Currently, we aren't showing any ELF basins. Let's set our plot to show the electride basin (the 4th "atom" in our system, i.e. index 3) and hide the electride dummy atom.
plotter.visible_atom_basins = [3]
plotter.atom_opacity = [1,1,1,0]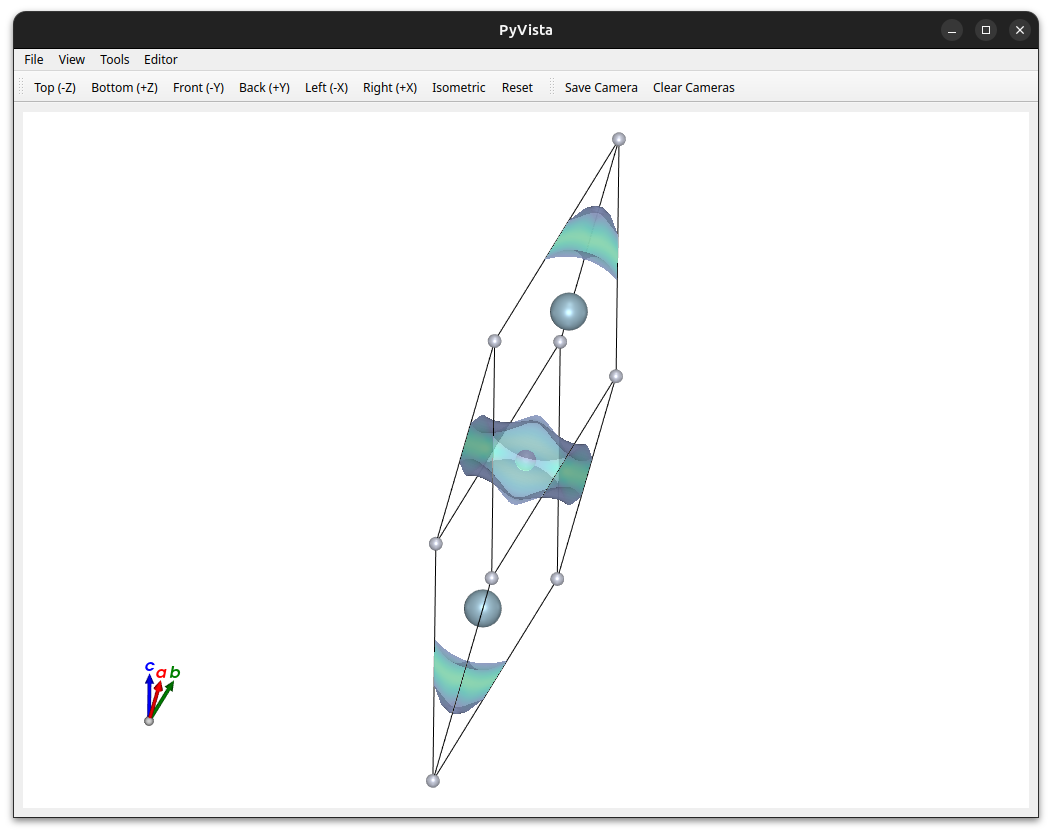
-
By default, BaderKit uses a colormap for the isosurface and caps. Let's change this to a solid color.
plotter.use_solid_cap_color = True
plotter.use_solid_surface_color = True
plotter.cap_opacity = 1.0
plotter.surface_opacity = 1.0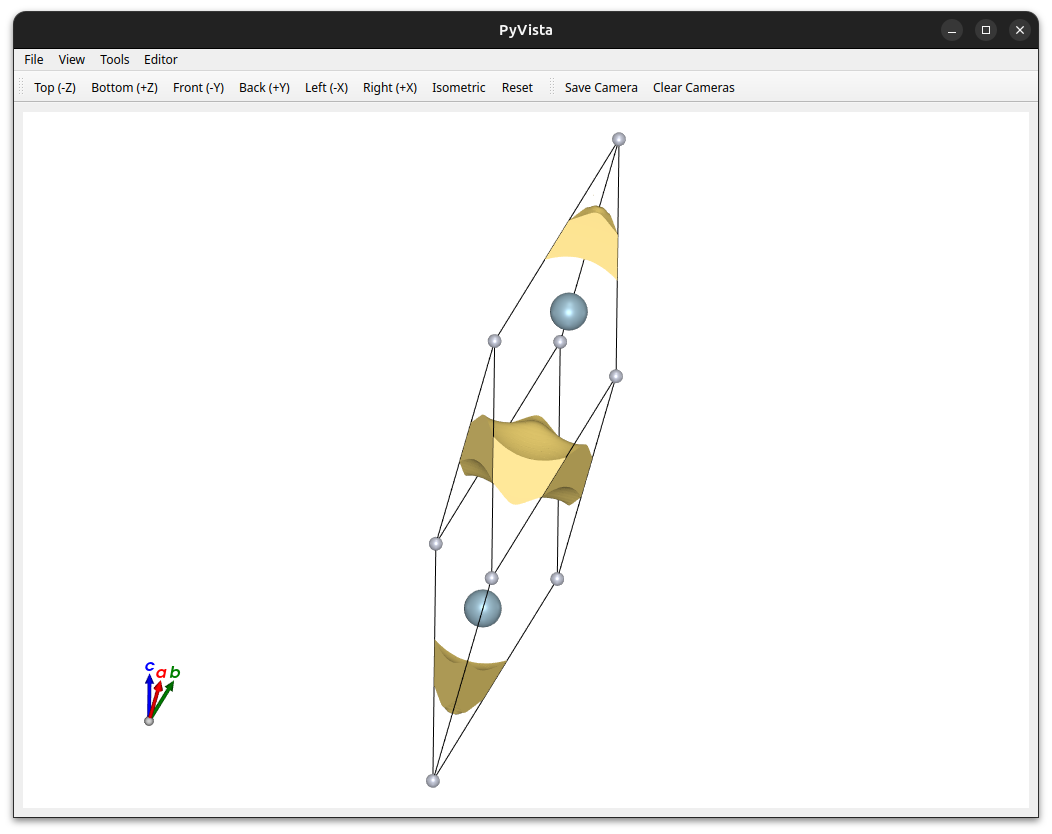
-
The current camera angle isn't ideal. While we could drag the viewer around to try and get it to a good place, it's much easier and more reproducible to do this programattically.
plotter.set_camera_to_hkl(1,1,0)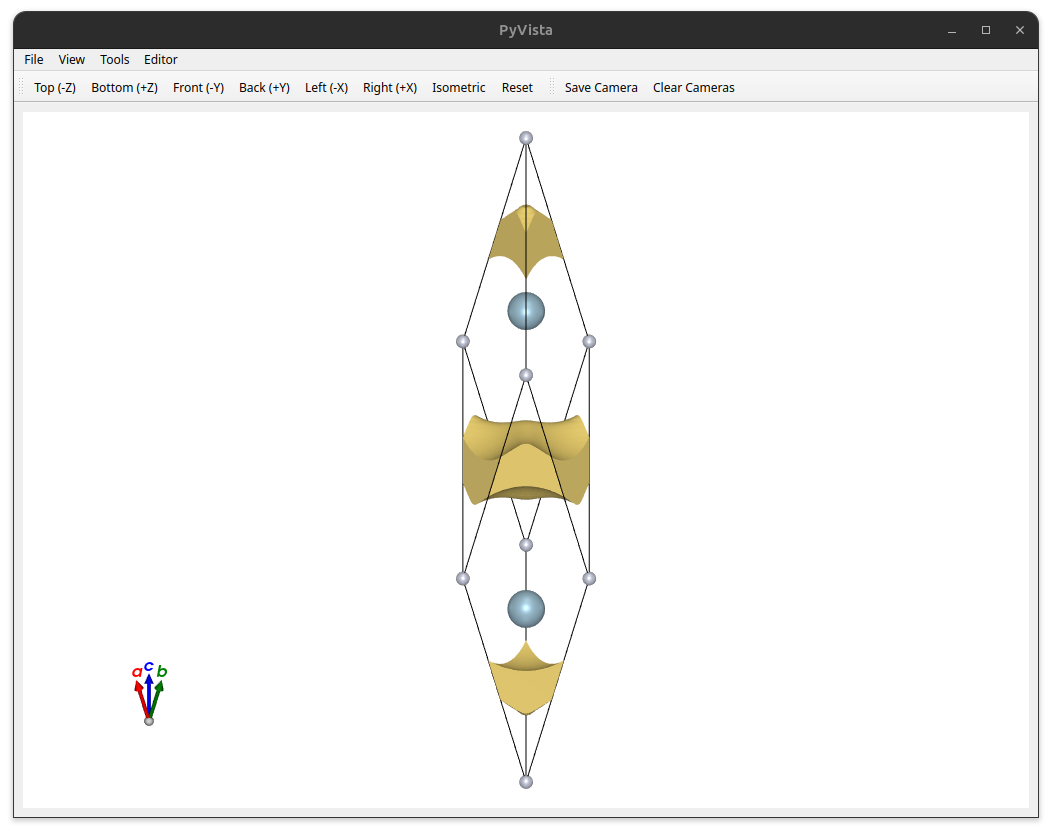
-
Finally, we should save our plot. You can do this from the viewer or through python.
Note that the python method allows us to script out plot generation. For those cases we recommend settingplotter.get_plot_screenshot( filename="Ca2N_electride.png", transparent_background=True )off_screen=Truewhen first generating the plotter to avoid starting the gui.
And that's it! The plotter can do much more, so try messing around with it on your own.
Download Resources
VASP Inputs/Outputs: Ca2N.zip
Tutorial Script: oxidation_states.py